
“Average” Life Expectancy in Financial Planning
Why relying on national averages creates a longevity risk

I’ve recently come across several financial plans on our platform where 80, or a similar age, was used for the plan’s duration. When I asked how this value was decided during the review, the owners said they simply relied on average life expectancy.
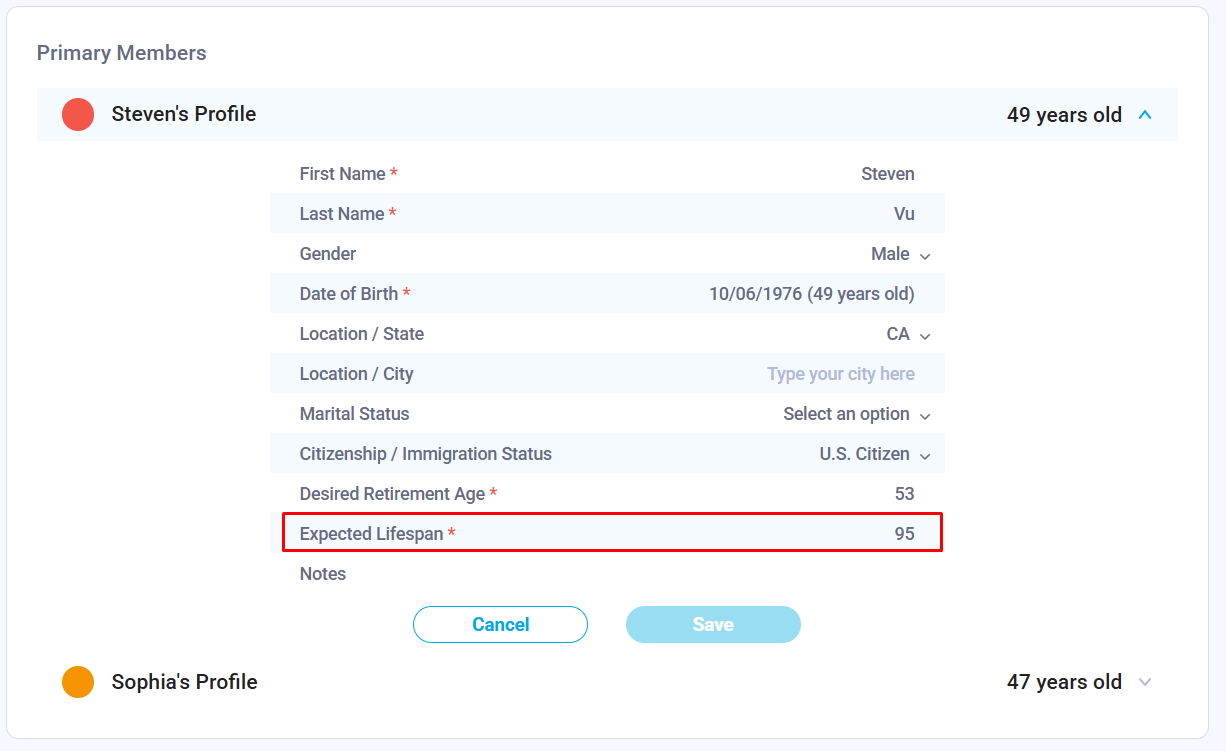
The average life expectancy in the US currently sits at around 79 years (2024 data). This breaks down to 81.4 years for females and 76.5 years for males.
But is it actually a good idea to use average life expectancy when building a financial plan?
To answer this question, I built a chart.
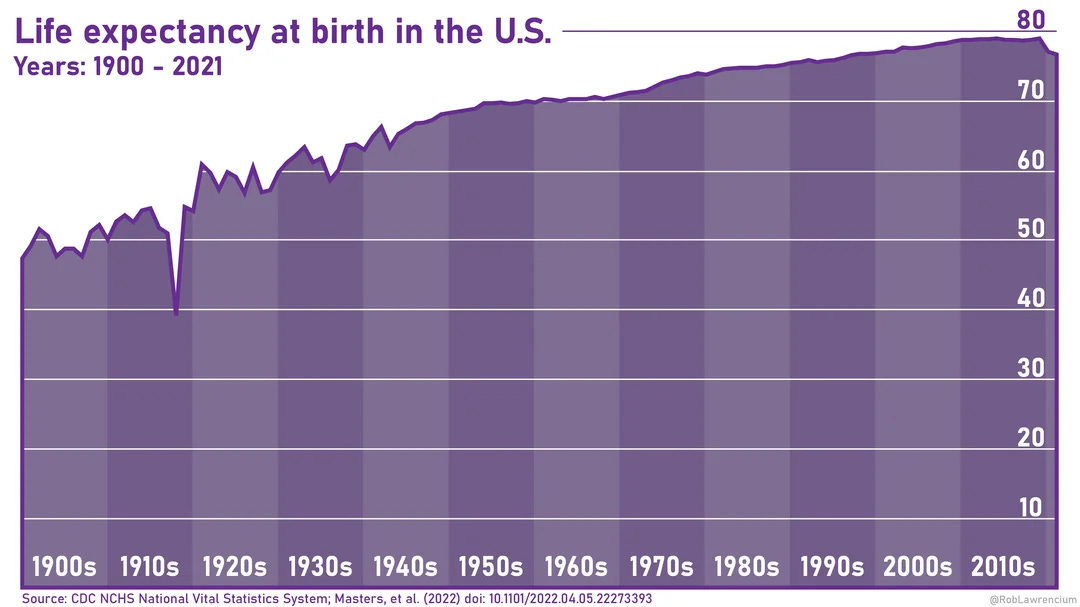
I took the data from the Actuarial Life Table 2022 available on the Social Security Administration website and created a chart that calculates the probability of family members being alive in any given year based on their birthday and gender. The chart also calculates the “family probability”, the likelihood of all selected family members being alive in a given year.
Then I considered a sample family: Steven (49) and Sophia (47), who also have parents Li (80) and Chen (77). Sophia turns 79 (the average life expectancy) in 2057. Assuming both Steven and Sophia have average health, here are their odds of making it to 2057:
Probability both Steven and Sophia make it: 36.8%
Probability only Steven makes it: 52.5%
Probability only Sophia makes it: 70.1%
Now we can see how misleading the “average” can be. Financial projections using 79 as an end date can create significant issues, particularly for younger female spouses, leading to flawed financial decisions.
When it comes to financial planning, it is always better to be conservative. That means planning for:
Slower income growth
Higher expenses
Lower investment returns
A longer life
It’s also worth noting that life expectancy is likely to increase. Currently, the United States has the lowest life expectancy among peer countries; as healthcare evolves, that gap may close, pushing these “averages” even higher.
One More Insight: The Value of Time
When families add their parents’ information to Nauma, they often discover an insight that goes beyond retirement balances. It’s a sobering reminder of how limited our time with our parents actually is.
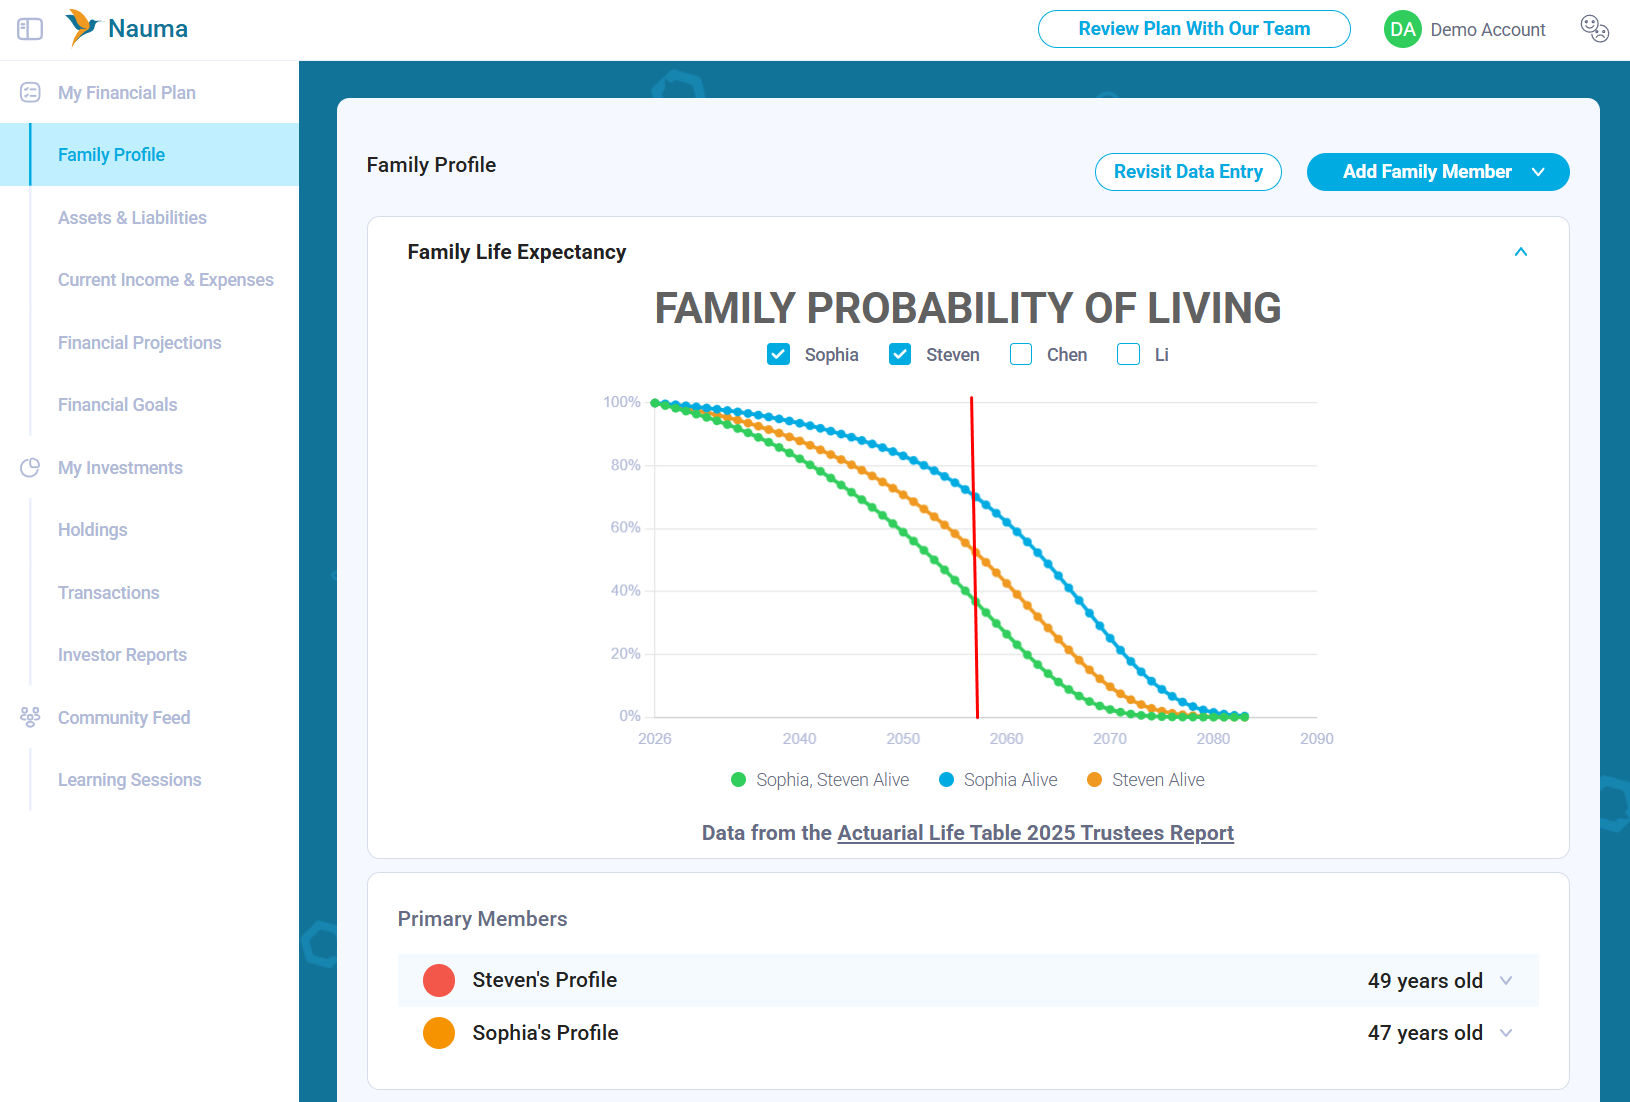
Take Steven’s parents, Li (80) and Chen (77). While Steven and Sophia are focused on their own “average” life expectancy decades away, the chart reveals a much more immediate timeline for the people they care about. It’s easy to assume our parents will always be there for the next big milestone, but the actuarial math tells a different story.
For Li and Chen, the probability that both will still be around drops significantly in just a few short years:
2028: 82.3% (Both are likely still here)
2031: 56.5% (A coin flip)
2034: 33.7%
2037: 16.3%
Seeing these numbers usually shifts the conversation. It moves from “how do we fund our 80s?” to “how do we make the most of the next five to ten years while everyone is still here?”
This data isn’t meant to be grim, but to help families prioritize the time they have left.
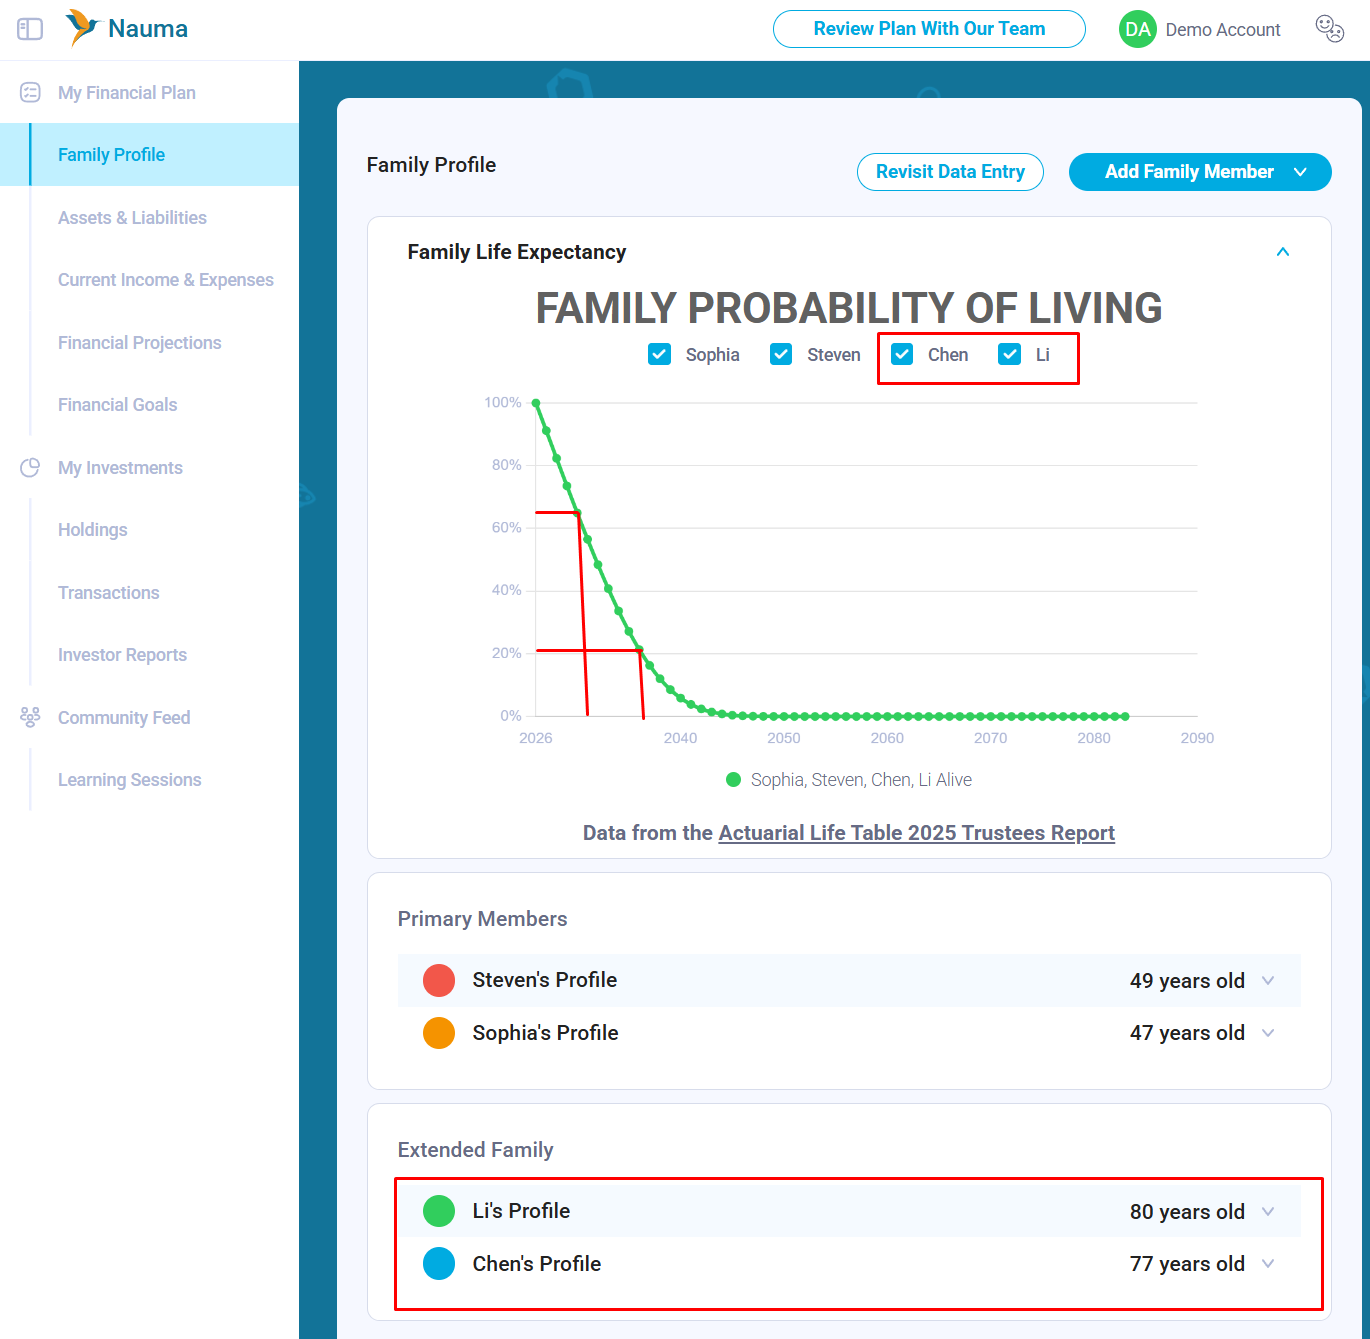
Setting Life Expectancy in Nauma
If you are just starting to use Nauma, you can set the Expected Lifespan for each family member in their Family Profile. Newly created financial projections will use these values to create corresponding milestones and set the correct duration for your plan.
If you already have financial projections created, you may want to review and adjust them. To do this, go to Financial Projections -> Milestones and update the dates there.

Life Expectancy & Portfolio Success
When we set financial goals and look at “portfolio success” probabilities, it’s important to remember that these calculations only measure the likelihood of the portfolio not running out of money. They don’t account for whether you will actually need the money.
For example: If our retirement fund has a 93% probability of success and the probability of both partners being alive in 2068 is only 5%, then the chance of the portfolio failing while both partners are alive is very small: 7% x 5% = 0.35%.
However, the probability that only Sophia is alive in 2068 is 33.1%. Therefore, the probability that the portfolio fails while Sophia is still alive is 7% x 33.1% = 2.3%.
When doing these calculations, you must keep both probabilities in mind to understand your true overall risk.

Planning for the “Tail End”
As the data shows, there is a significant chance that those relying on statistical averages will outlive their savings. To build a plan that stands the test of time, keep these principles in mind:
Plan for Longevity, Not the Median: The “average” life expectancy as a starting point, building a “buffer” into your plan by projecting into your 90s (or beyond) will help reduce the risk of outliving assets.
Account for Joint Probability: If you are part of a couple, the odds of at least one of you surviving well past the average are much higher than for a couple. Your plan needs to protect the surviving spouse.
If you’re using Nauma, take a moment today to review your family profile. Adjusting your expected lifespan to a more conservative age, such as 90 or 95, can provide a much clearer picture of your long-term success rate.