
The Safe Withdrawal Rate: Do You Need Bonds in Retirement?
Stress-testing an equity-only portfolio against a custom glide path in retirement

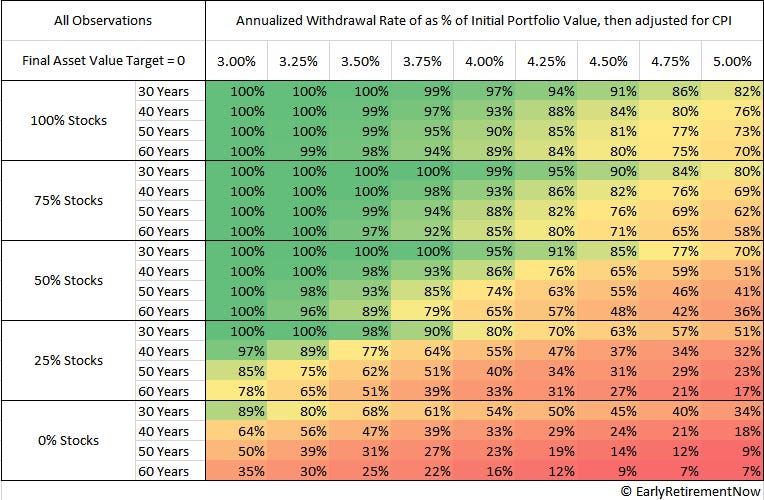
Karsten Jeske did a great analysis of safe withdrawal rates on his blog and created this table by writing a script that loops through all possible combinations of retirement dates and estimates the probability of a portfolio not running out of money using a constant withdrawal rate between 3.00% and 5.00% (inflation-adjusted).
Karsten used historical stock and bond returns from 1871 to 2016 and tested his model across different stock/bond allocations: 0%, 25%, 50%, 75%, and 100% stocks, as well as different retirement durations: 30, 40, 50, and 60 years. While the information is dense, the table is highly readable and uncovers great insights:
The more stocks the portfolio has, the higher the chances of it not running out of money given all other factors the same.
The 0% stock portfolio performs poorly across almost all longer horizons.
Going from 4.00% to 5.00% may sound like a small change, but the success-rate drop can be large.
One of the most common questions people ask when they look at this table is: “If portfolios with 0% bond exposure have historically had a higher chance of surviving, why don’t we use them and simply ignore bonds in retirement?”
It’s a legitimate question.
Traditional Retirement Portfolios
While historical data over multi-decade horizons demonstrates that equities provide better long-term compounding and frequently yield higher mathematical success rates, institutional wealth management continues to use bonds in retirement portfolios for the following reasons:
1. The Mitigation of Sequence of Returns Risk (SRR)
If a market crash happens while we are saving for retirement, it creates a buying opportunity. But if a crash happens right after we retire, we are forced to sell stocks at a loss to pay for living expenses. This permanently shrinks the portfolio and makes it incredibly hard to recover. Bonds act as a financial cushion, allowing us to spend fixed income during a downturn while giving the stocks time to bounce back.
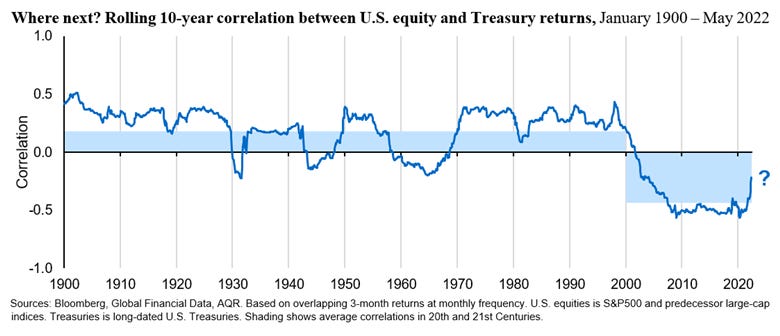
Historically, bonds have demonstrated low or negative correlation to equities. Adding bonds in the portfolio increases risk-adjusted returns and chances of not running out of money in retirement.
2. Behavioral Finance and Capitulation Risk
While the Karsten spreadsheet model assumes a perfectly rational agent who can withstand a 50% drop in net worth without altering their strategy, real-world wealth management must account for human psychology. This introduces capitulation risk: the probability that an investor will panic during a prolonged market crash and liquidate their portfolio at or near the absolute bottom.
Portfolio Glide Path in Financial Models
When we look at Karsten’s table, we are looking at static allocations. The model assumes you pick one specific asset mix like 100% Stocks or 50% Stocks and blindly hold it for 30 to 60 years.
This creates a frustrating financial paradox:
If you go 100% Stocks: You maximize long-term compounding, but you expose yourself to a catastrophic Sequence of Returns Risk in the first few years of retirement.
If you go 50% Stocks: You protect yourself against a near-term crash, but over a 50-to-60-year retirement, your success rate plummets because your portfolio lacks the growth engine required to outpace long-term inflation.
But what if you didn’t have to choose a static row? What if your portfolio could adapt dynamically over time? Instead of keeping asset allocation locked, a portfolio glide path dynamically shifts your exposure based on where you are in your retirement timeline. You can pick a more aggressive allocation If you are a 10+ years away from your retirement, and reduce portfolio stock exposure over time as you get closer to the time when you need the money.
Karsten introduces Rising Equity Glide Path (or Bond Tent) in his safe withdrawal rate series. He argues that the investor can enter retirement conservative (e.g., 60/40) to survive Sequence of Returns Risk, and then increase equity exposure (gliding back up to 80% or 100% stocks) inside retirement.
Stock Only vs Custom Portfolio Glide Results
Designing a portfolio glide path is an individual decision based on the investor’s risk tolerance and financial plans. The results will heavily depend on the family’s net worth, future income and expenses, and taxes.
To see how these dynamics play out, we ran a hypothetical scenario through the Nauma platform:
Family M49 and F48. Live in California. Two kids (11 and 14)
Net Worth $6M ($2.4M taxable, $1.6M Tax-Deferred, and $490K in tax-free accounts)
Current Income $720K, Total expenses $254K, taxes $250K
They currently plan to work for another 8 years
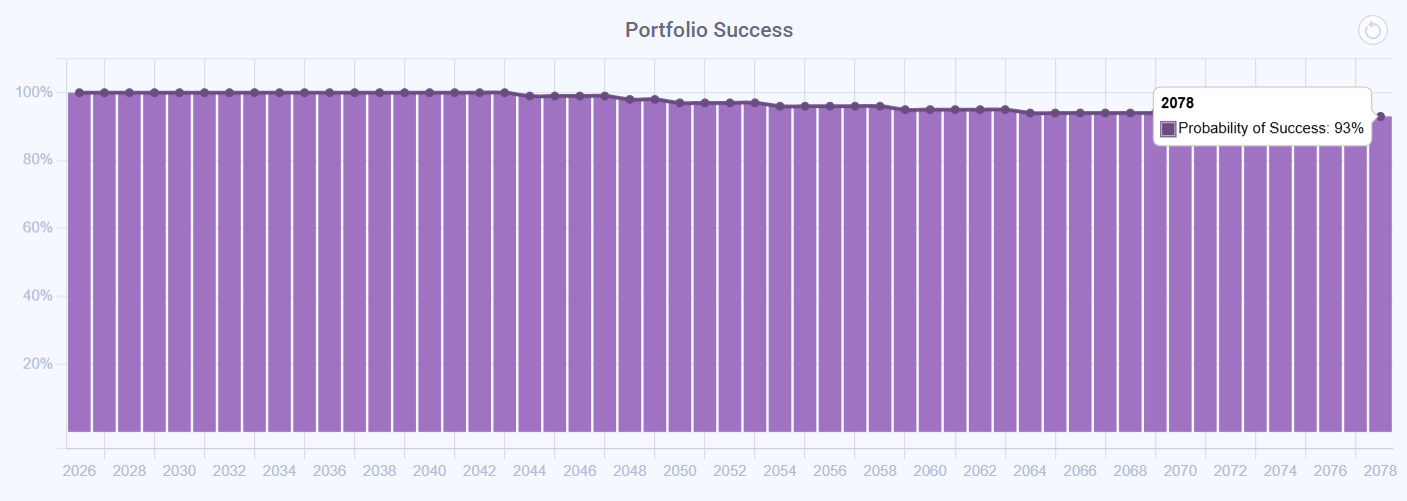
The results are quite interesting. For their retirement fund, the Aggressive portfolio (95% equity, 5% cash) had a 94% success rate when tested in a Monte Carlo simulation, while a Portfolio Glide Path (95% equity → 60% equity for the rest of the plan) had a 93% success rate. This is in line with Karsten’s findings, despite some differences in the market data. Karsten used data from 1871 to 2016, while Nauma uses data from 1992 to the present.
Aggressive Portfolio:
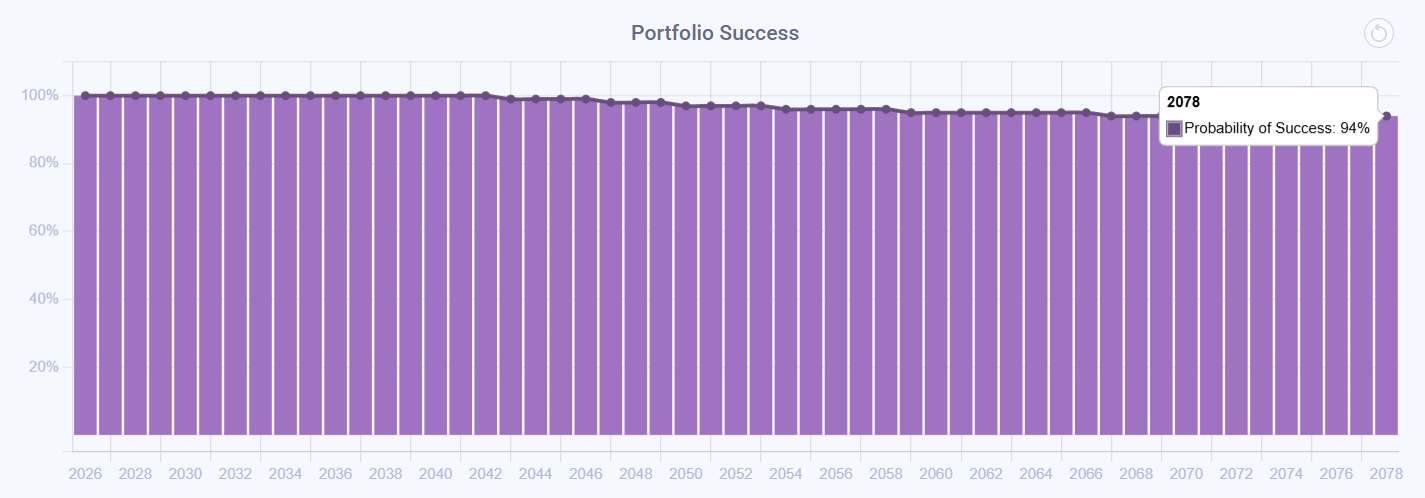
Portfolio Glide Path:
While the overall success rates appear nearly identical, looking under the hood at the distribution of outcomes reveals the true strategic trade-off.
At the overall household level (Module 4) where all financial goals are blended together, the Aggressive portfolio showed better results across all percentiles except p1 and p2. To clarify, the p1 percentile means that among 10,000 Monte Carlo simulation runs, 99% of runs, or 9,900 runs, demonstrated better performance.
The table below illustrates the projected ending value of the entire blended household portfolio across different simulation percentiles:
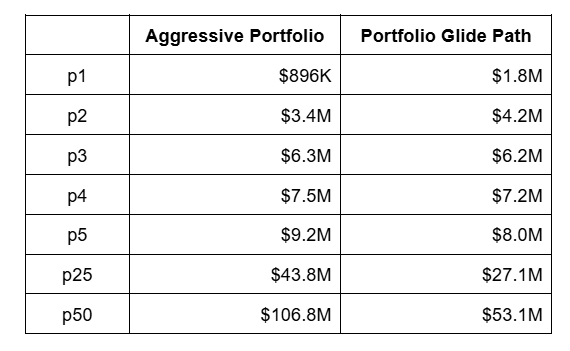
With this data, the family can now make a significantly more informed decision about whether they want to use a Portfolio Glide Path or stick with an Aggressive, equity-heavy portfolio.
When using the Portfolio Glide Path, the simulation demonstrated greater resilience in worst-case economic scenarios, such as the 2000 Dot-Com bust or the 2008 Financial Crisis, resulting in improved p1 and p2 metrics. The opportunity cost of that downside protection, however, is a roughly 2x lower median portfolio value at the end of their financial plan ($53.1M vs. $106.8M).
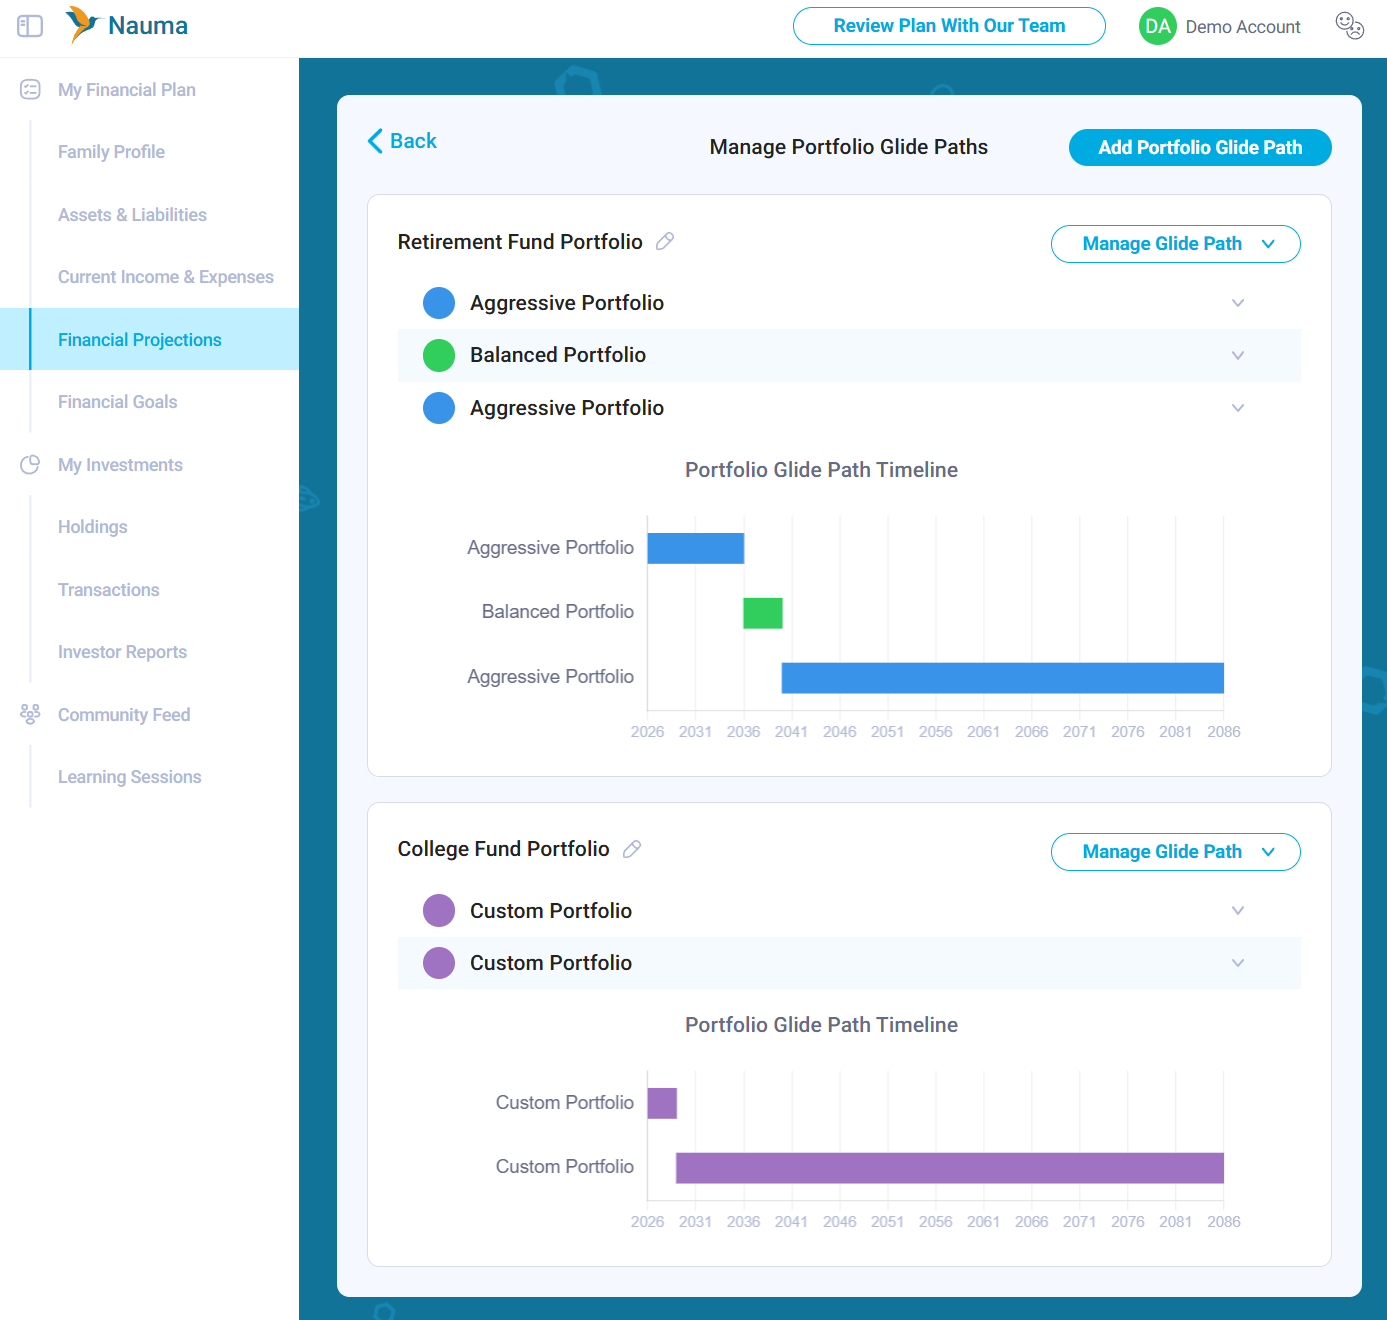
How to Configure Portfolio Glide Paths
There are two options for how you can configure your own Portfolio Glide Path in Nauma.
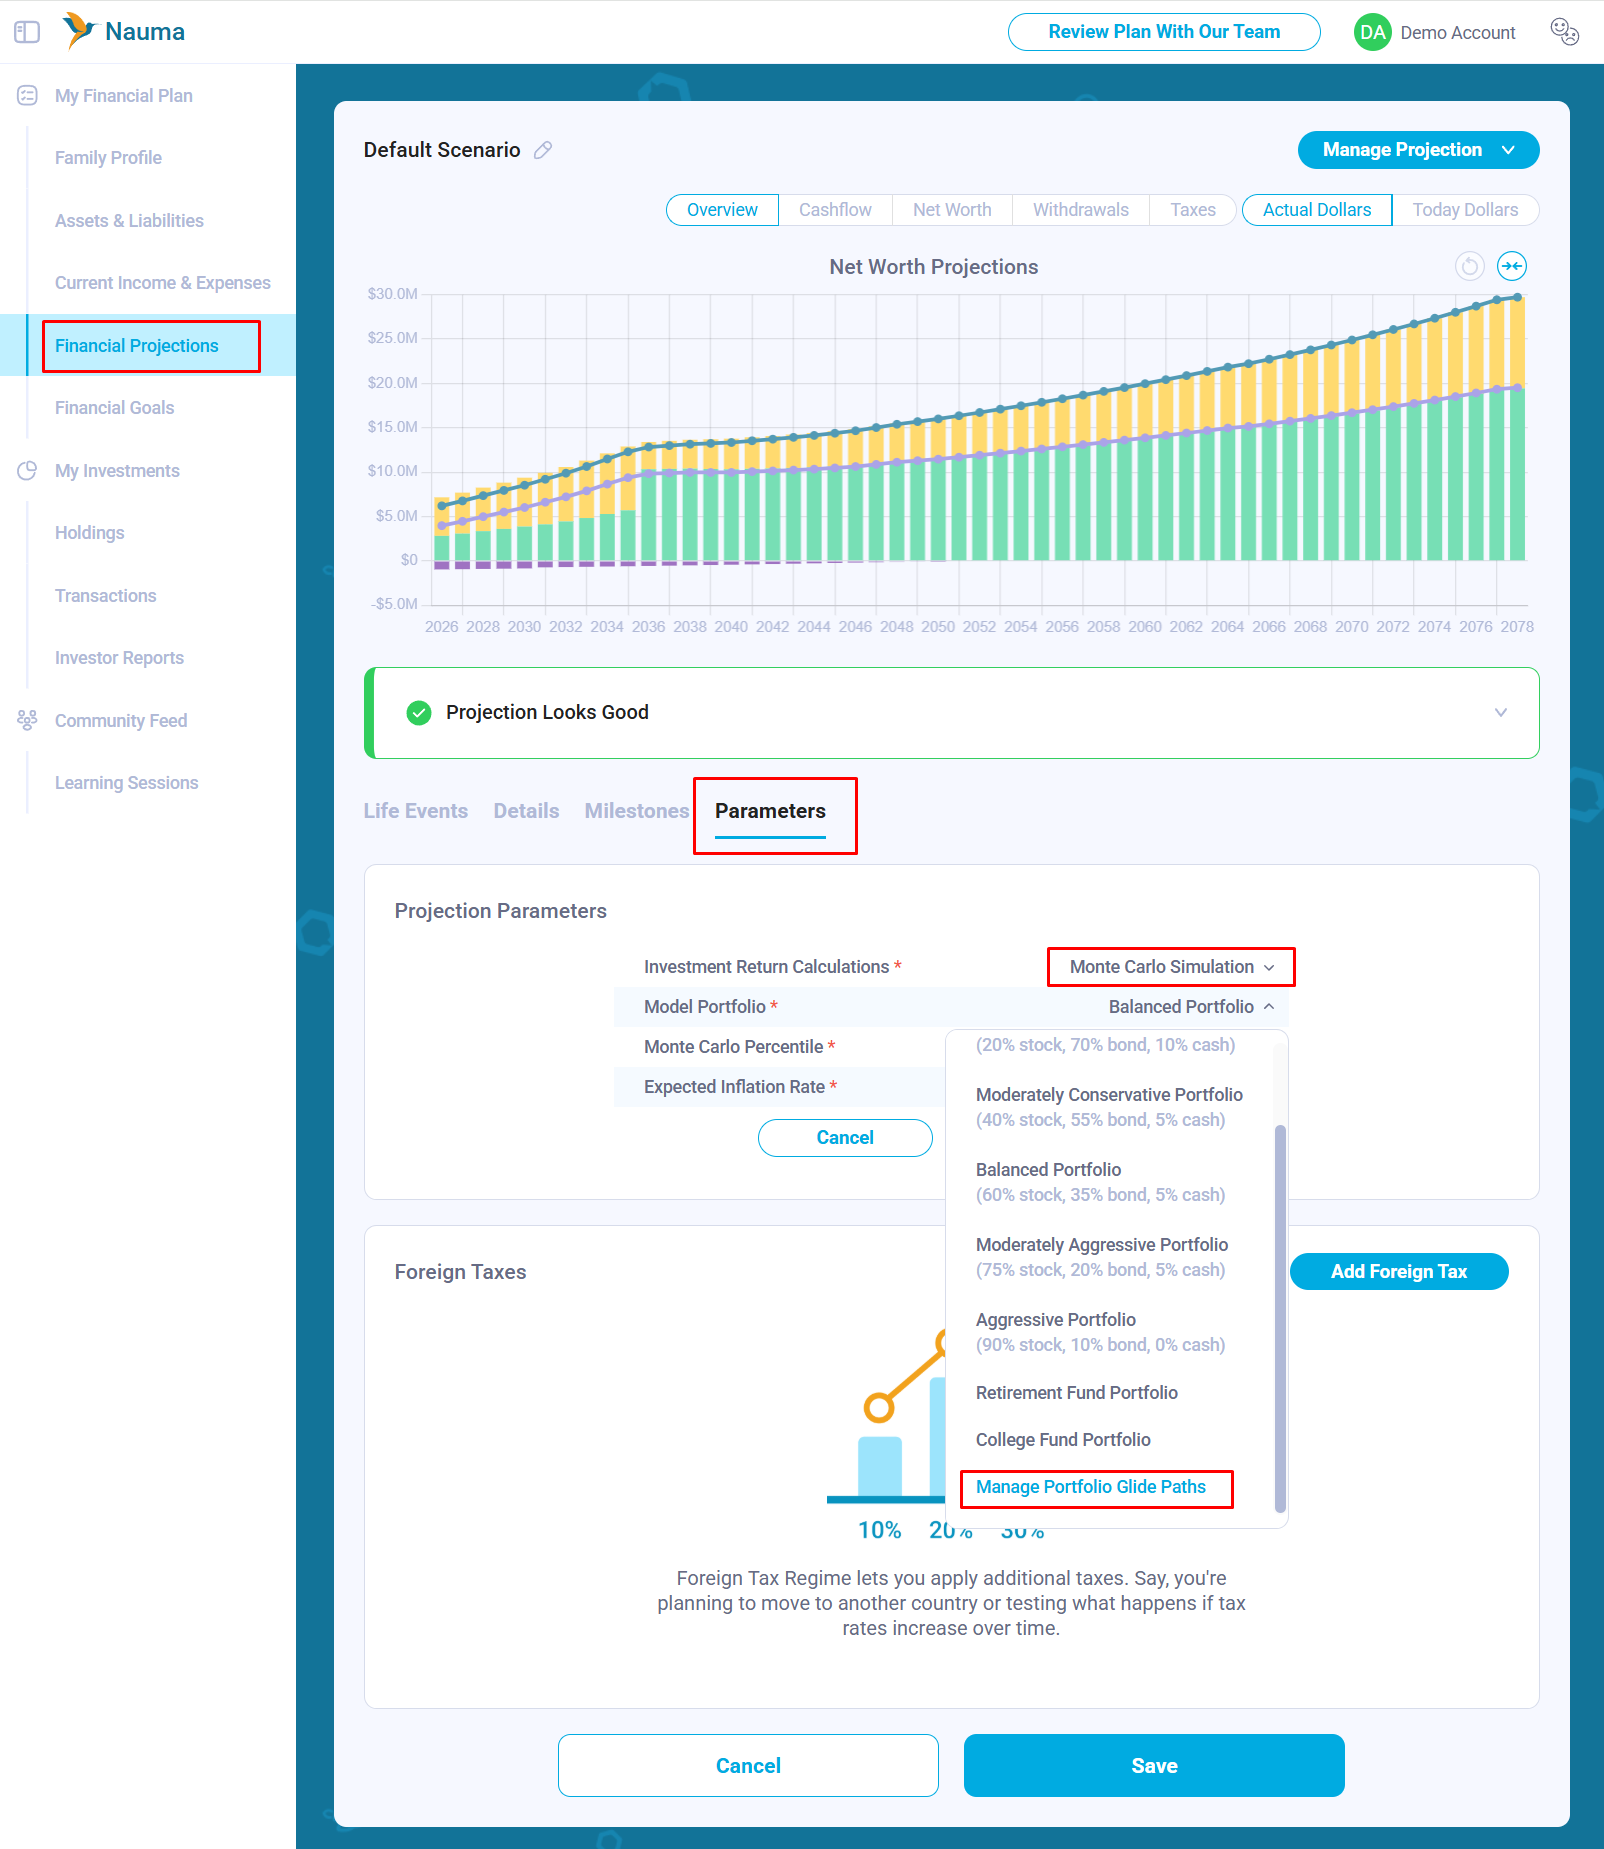
The platform offers planning at both the household and goal levels and provides two ways to create and manage custom portfolio glide paths. If you are working on your financial projection in Module 4, go to Parameters, set Investment Return Calculations to Monte Carlo Simulation, and then select Manage Portfolio Glide Paths in the newly appearing Model Portfolio field.
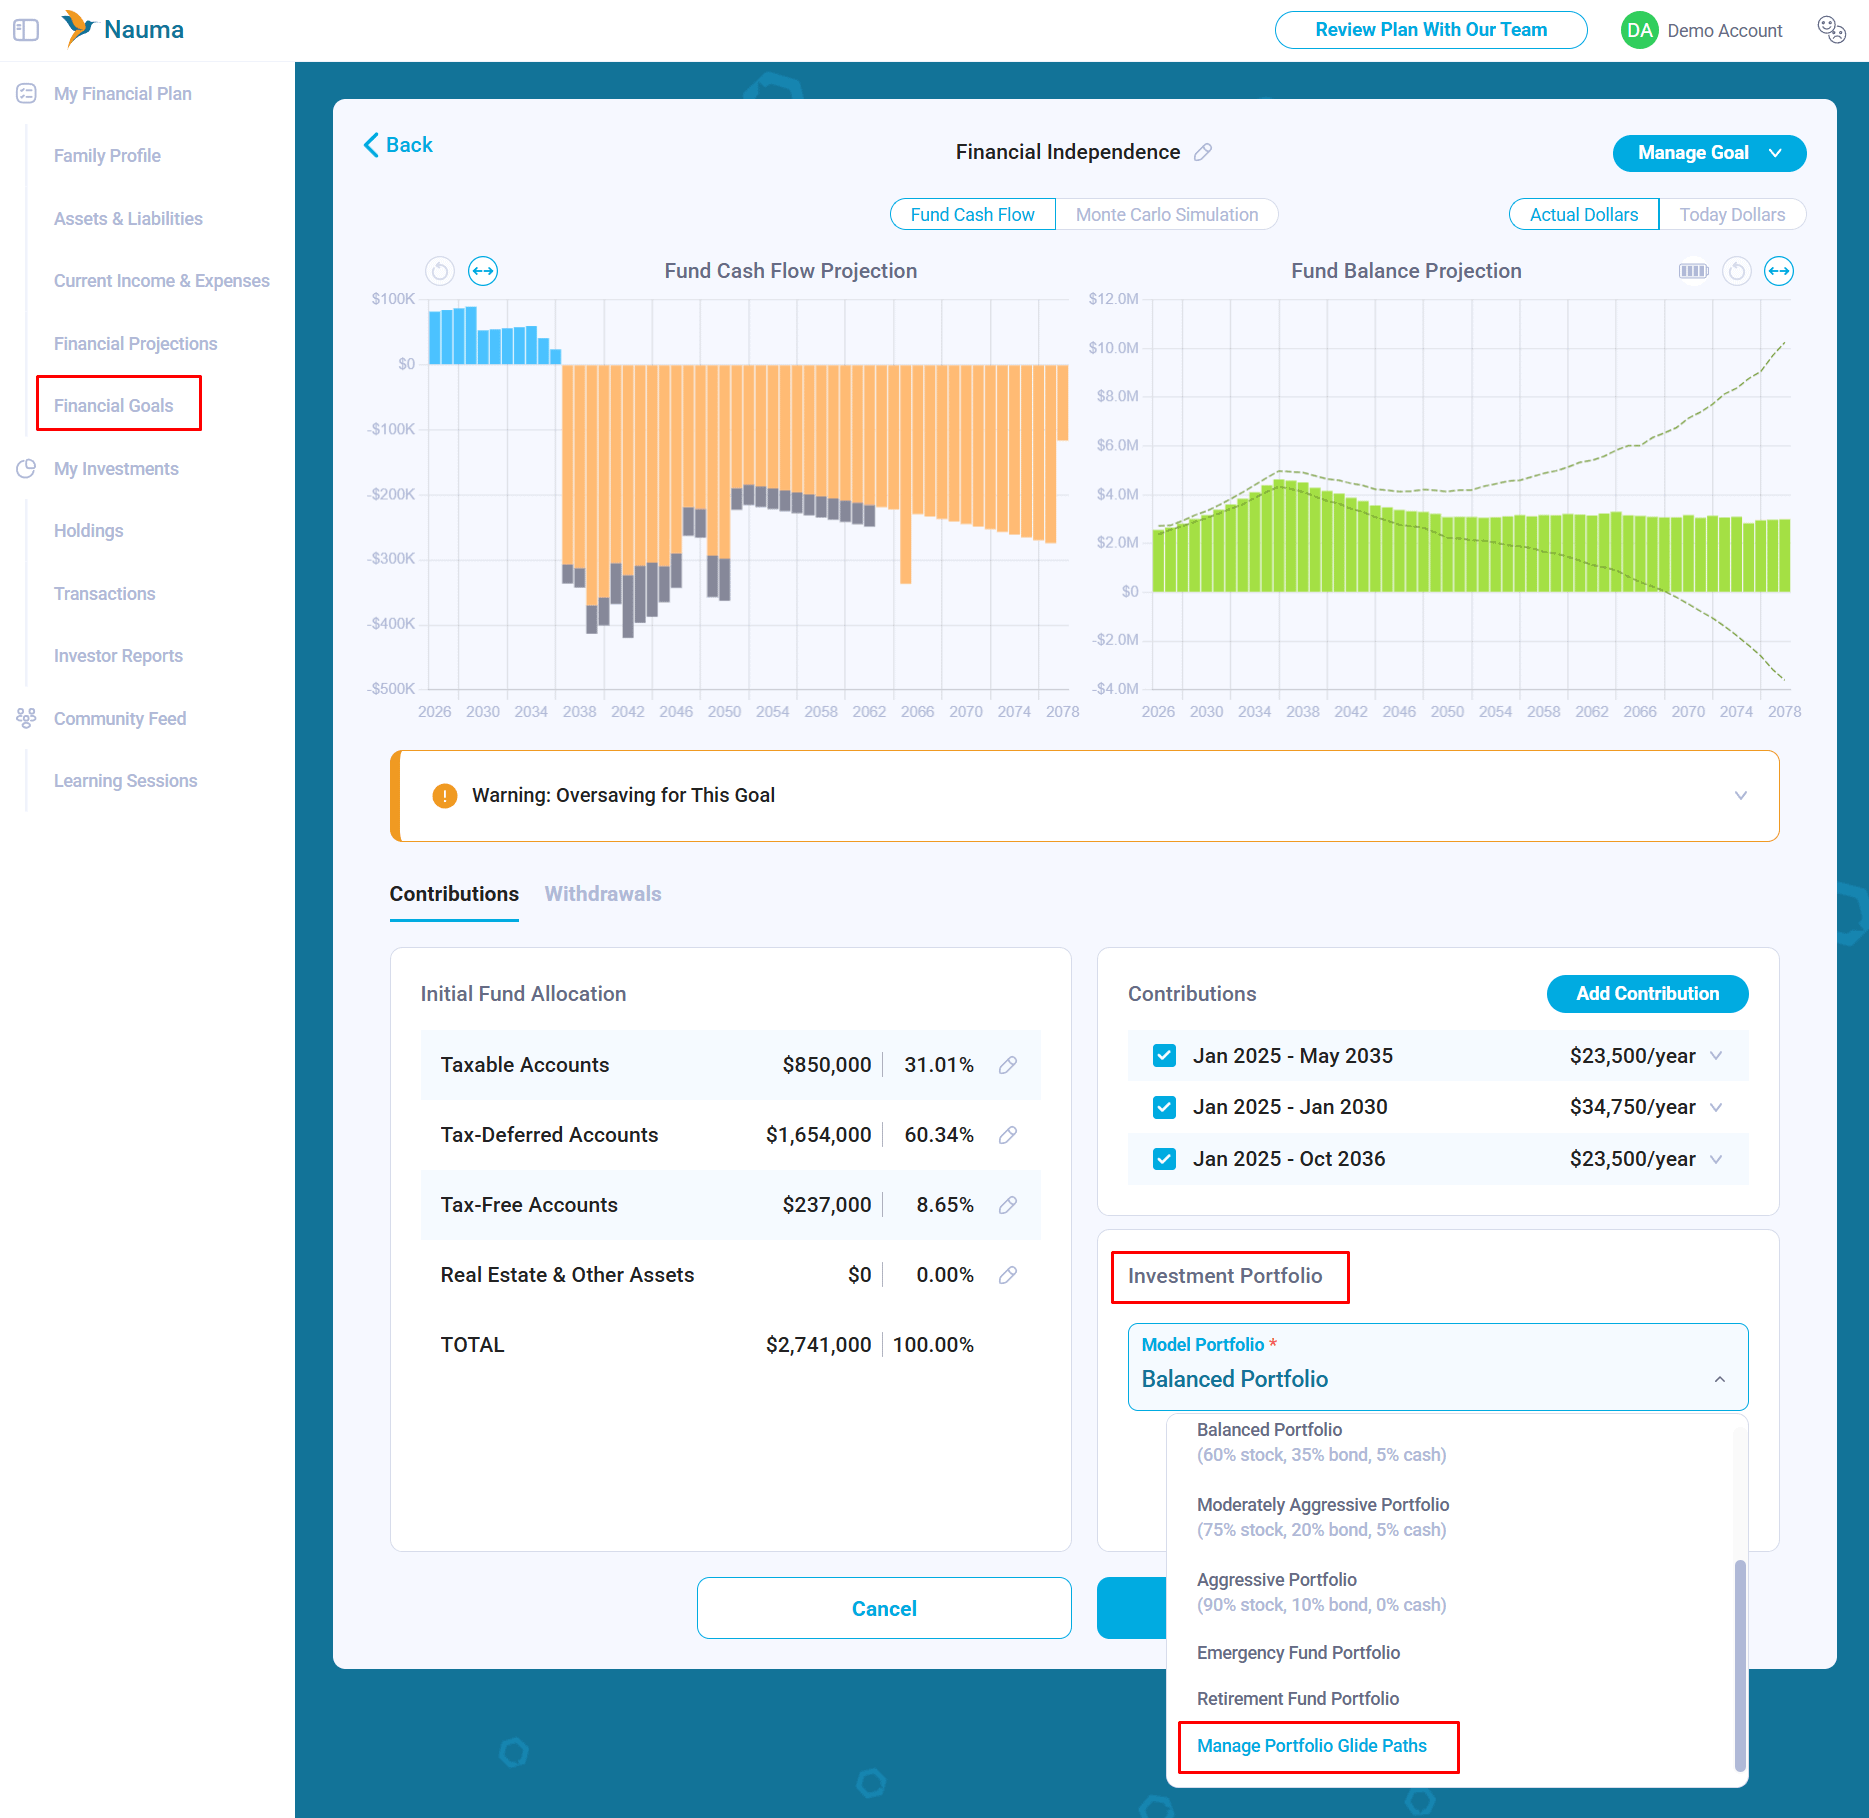
If you are setting your financial goals in Module 5 and working at the fund level, click the Model Portfolio dropdown and scroll down to Manage Portfolio Glide Paths.
Portfolio Glide Paths are owned by the Financial Projection and shared across Module 4 and Module 5. This means you can reuse a Portfolio Glide Path created in your financial projection later when you start working on your financial goals.
Context Over Cookie-Cutter Advice
Generic financial advice is almost always engineered for the lowest common denominator, pushing conservative allocations because they must work safely for the masses. But high-net-worth tech families often possess unique cash flow structures, equity compensation buffers, and higher personal risk tolerances that make equity-heavy strategies a natural avenue to explore for them.
The main challenge for these families is not knowing their true risk tolerance unless they have already lived through several market cycles and seen how they actually react. Most people know, intellectually, that they should not sell when the market crashes. They answer risk-tolerance questionnaires logically and describe what they would do in a hypothetical downturn. But when a real market crash happens, emotions often take over, and people make very different decisions.
Adding non-correlated assets, such as bonds or managed futures, may reduce portfolio volatility and help investors avoid panic selling. But that benefit comes at a cost.

About the Author: Alex Sukhanov, founder of Nauma, a financial planning platform built for people in tech and high-net-worth families. Alex previously worked at Google and started Nauma to help more people in tech make better financial decisions and achieve more in their lives. You can reach out to Alex on linkedin.
Nauma is supported entirely by its users with no commissions and no affiliate incentives. It is designed to give people clarity on taxes, equity compensation and retirement planning.
Disclaimer: Nauma projections are hypothetical and not guarantees of future results. Tax laws may change, and estimates may not reflect future legislative updates. This content is for educational purposes only and is not tax or investment advice.