
🏠 Buy vs. Rent: Which One Builds More Wealth?
A data-driven look at how mortgage rates, home appreciation, and liquidity shape the rent-versus-buy decision.

It’s one of the biggest financial questions families face: Should we keep renting, or buy a home?
It sounds simple — but the answer depends on your unique situation, assumptions, and goals.
In this post, I’ll walk through a real scenario analysis we ran in Nauma, showing how the numbers change under different assumptions.
The Case Study
Let’s start with a real-world example.
A couple in their late 30s, with two kids, is trying to decide whether to keep renting or buy a home.
Here’s their financial snapshot:
Household income: $350,000 (pre-tax)
Savings: $600,000 in a taxable account
Currently renting: $5,000/month
No existing real estate or debt
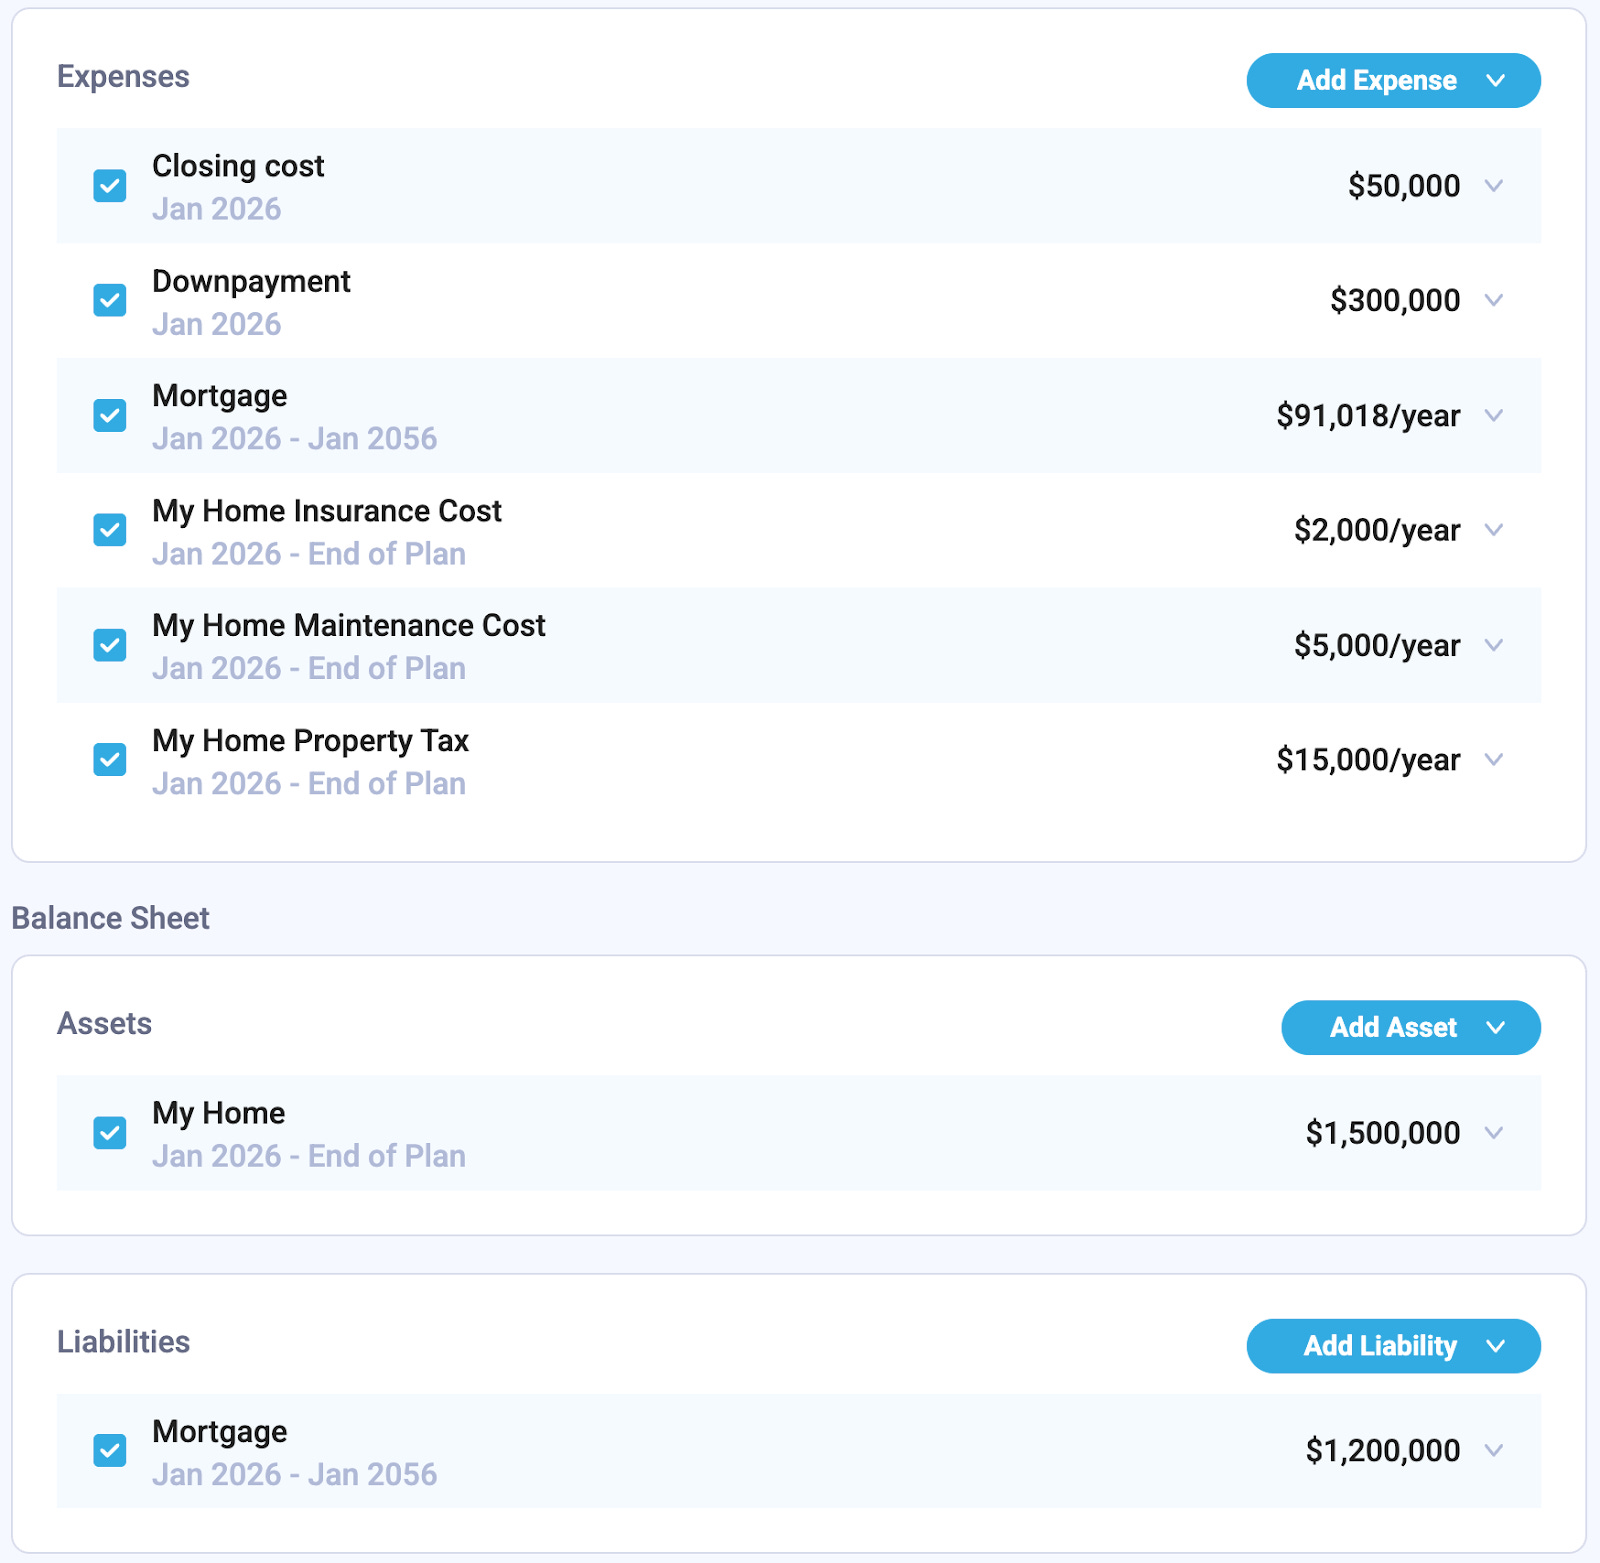
They’re considering buying a $1.5 million home with a 20% down payment ($300,000) in 2026.
For simplicity, we’ll express everything in today’s dollars — meaning we adjust future values for inflation so that all amounts reflect their value in today’s purchasing power.
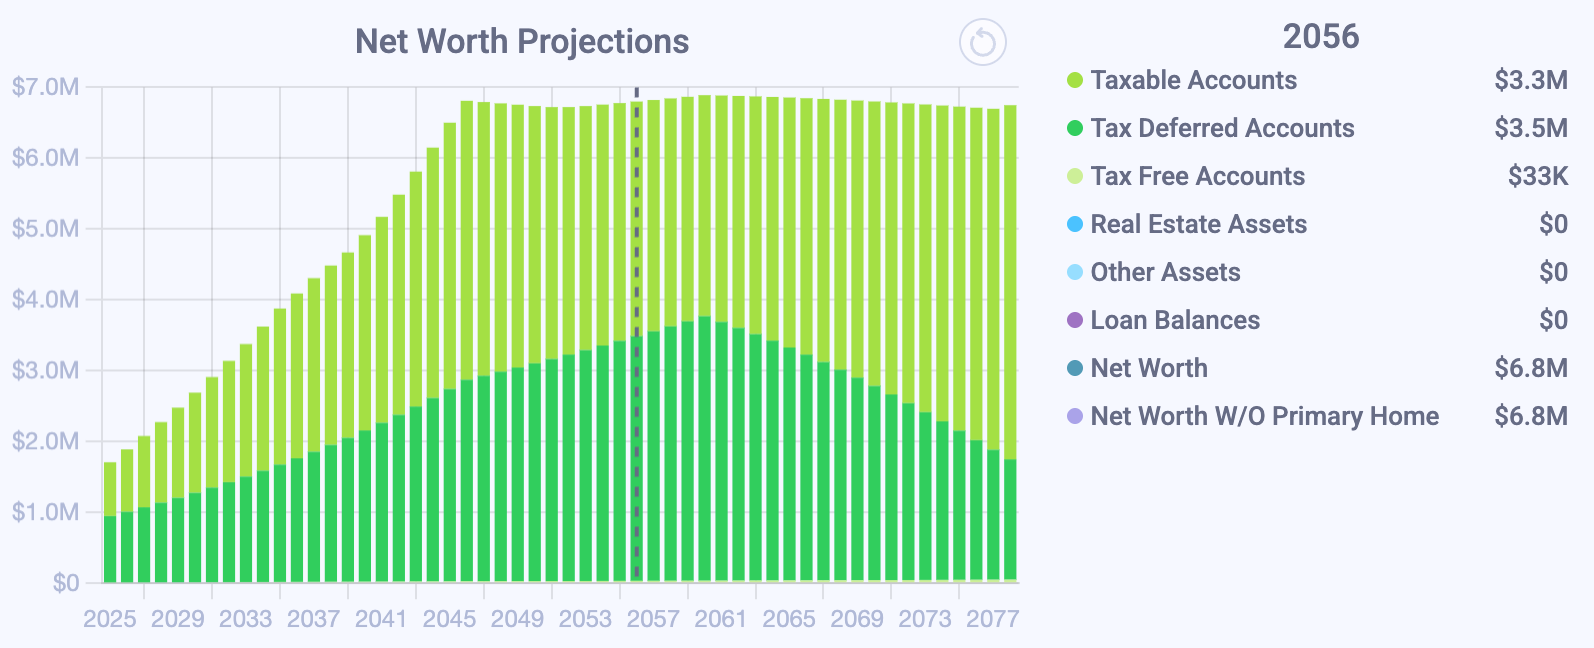
Scenario 1: Keep Renting
If they continue renting, they pay $5,000/month (increasing with 2% inflation).
All of their assets remain liquid — mostly invested in taxable and retirement accounts.
After 30 years, (end of 2056), they will have
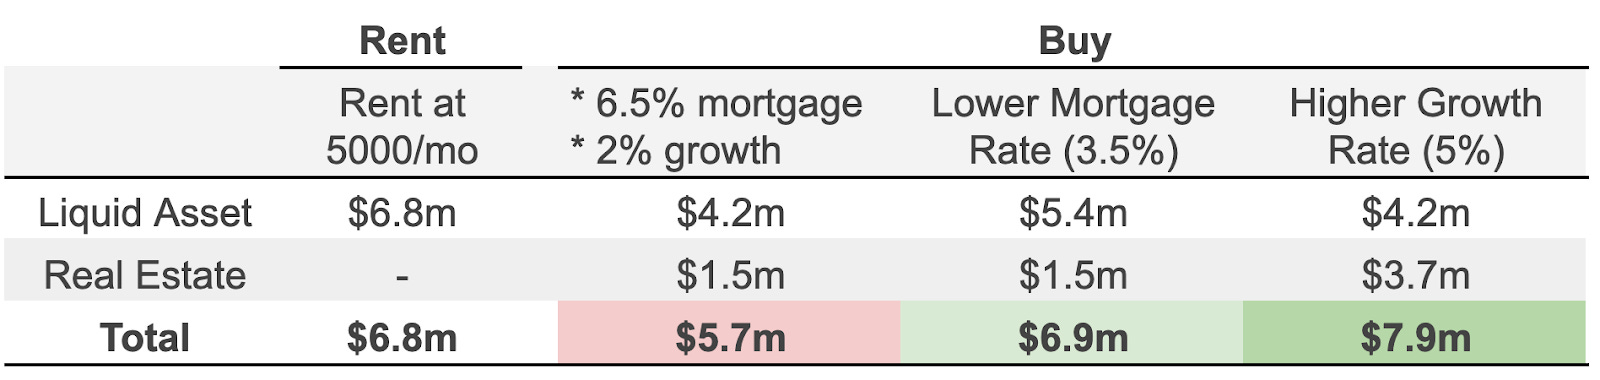
$6.8 million net worth (today’s dollars)
All in liquid assets — easy to access and flexible
Scenario 2: Buy a Home (6.5% Mortgage, 2% Appreciation)
Now let’s see what happens if they buy a home.
They put $300K down and pay about $50K in closing and moving costs, then take out an 80% mortgage at 6.5% for 30 years.
After three decades, their projected results look like this:
Net worth: $5.7 million
Includes $1.5 million in home equity and $4.2 million in liquid assets
In this scenario, buying ends up roughly $1 million lower than renting — mainly because of higher borrowing costs and slower property appreciation.
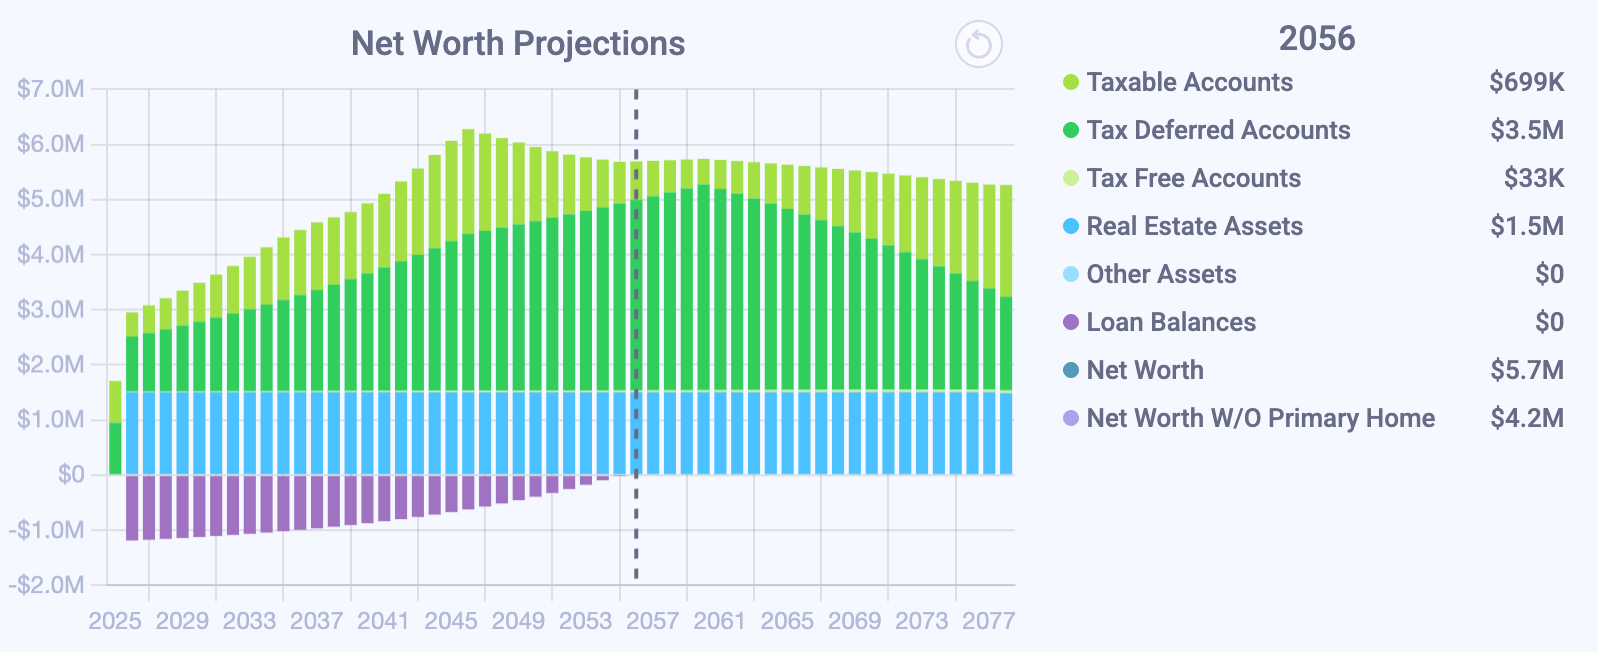
We’ve assumed the home value grows at 2% per year, matching the inflation rate. Since we’re expressing everything in today’s dollars, that means the home’s value stays flat at $1.5 million over time in real (inflation-adjusted) terms — shown as the constant blue bar in the chart.
Scenario 3: Lower Mortgage Rate (3%)
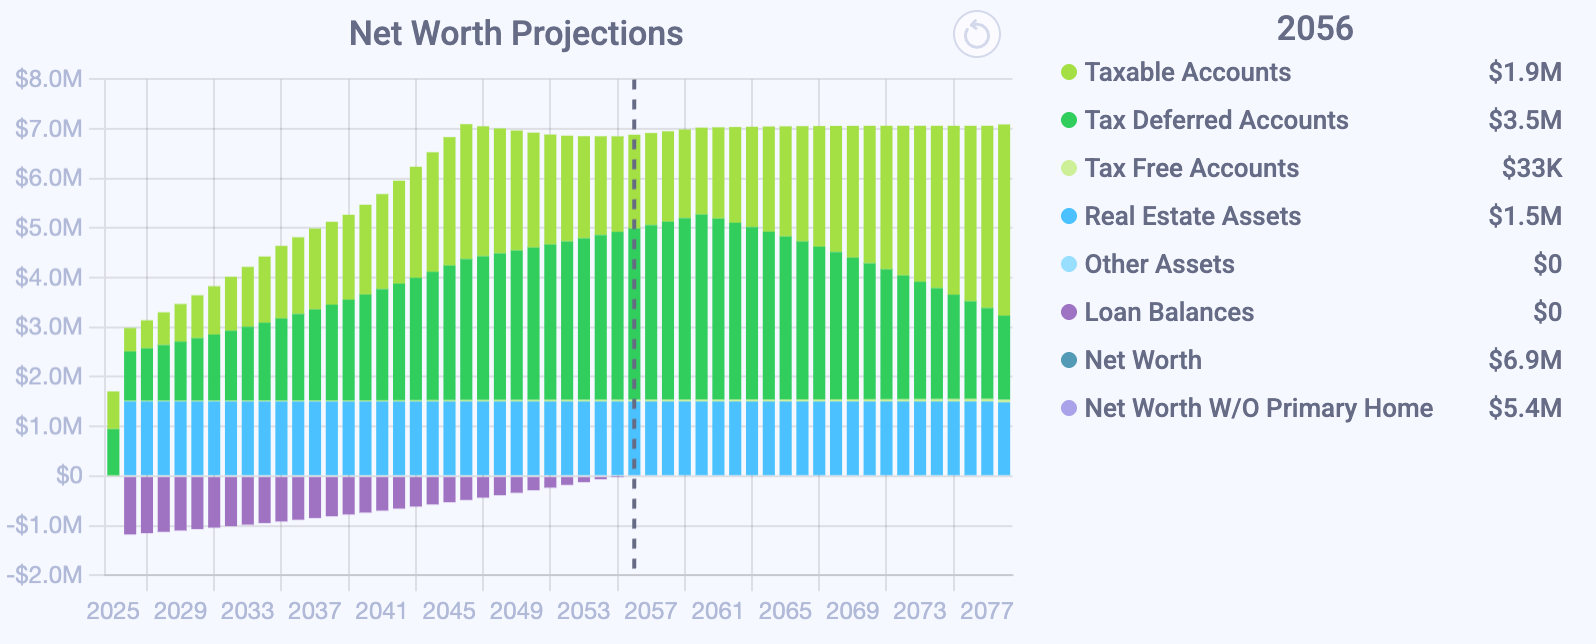
Now, let’s see what happens if they secure a 3% mortgage rate instead.
Lower interest means smaller monthly payments — and that frees up more cash flow to invest elsewhere. Over time, that compounding difference really matters.
Here’s the result:
Net worth: $6.9 million
Slightly higher than renting
Even a few percentage points in mortgage rates can completely change the outcome — turning buying from a financial drag into a long-term advantage.
Scenario 4: Faster Home Appreciation (5%)
In some markets — especially places like California — home values have historically grown much faster than inflation.
Let’s keep the mortgage rate at 6.5%, but assume the home value appreciates at 5% per year instead of 2%.
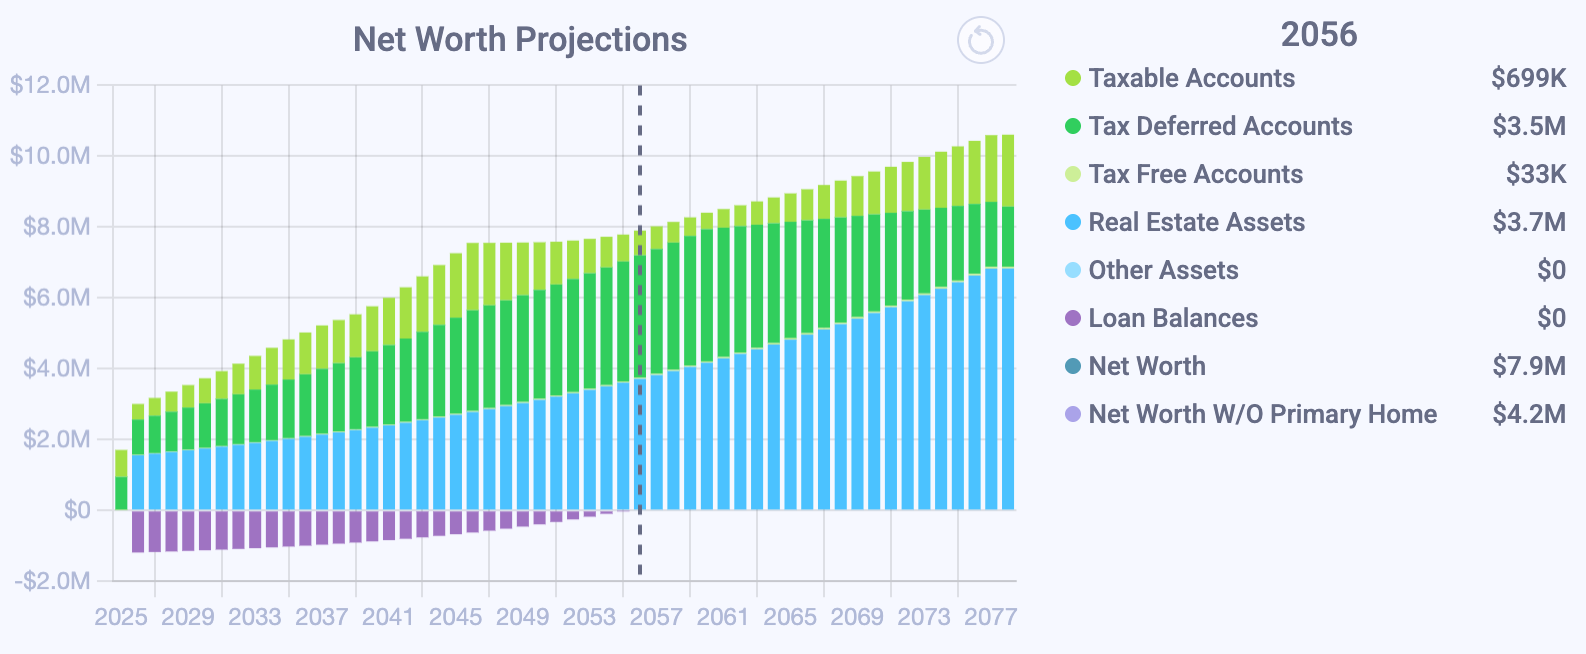
Net worth: $7.9 million
About $1 million higher than renting
Even with the same borrowing cost, stronger property growth turns buying into the clear winner. The faster appreciation not only builds home equity more quickly but also pushes total net worth above the renting scenario — showing how much long-term results depend on local housing trends.
But There’s a Catch: Liquidity
One important factor people often overlook is liquidity — how easily your wealth can be accessed when you need it.
When you buy a home, a large portion of your net worth becomes tied up in home equity. It looks great “on paper,” but it’s not cash you can easily use without selling or borrowing against your house.
In our model, if this couple decides to retire early (say at age 52), they actually face a liquidity gap:
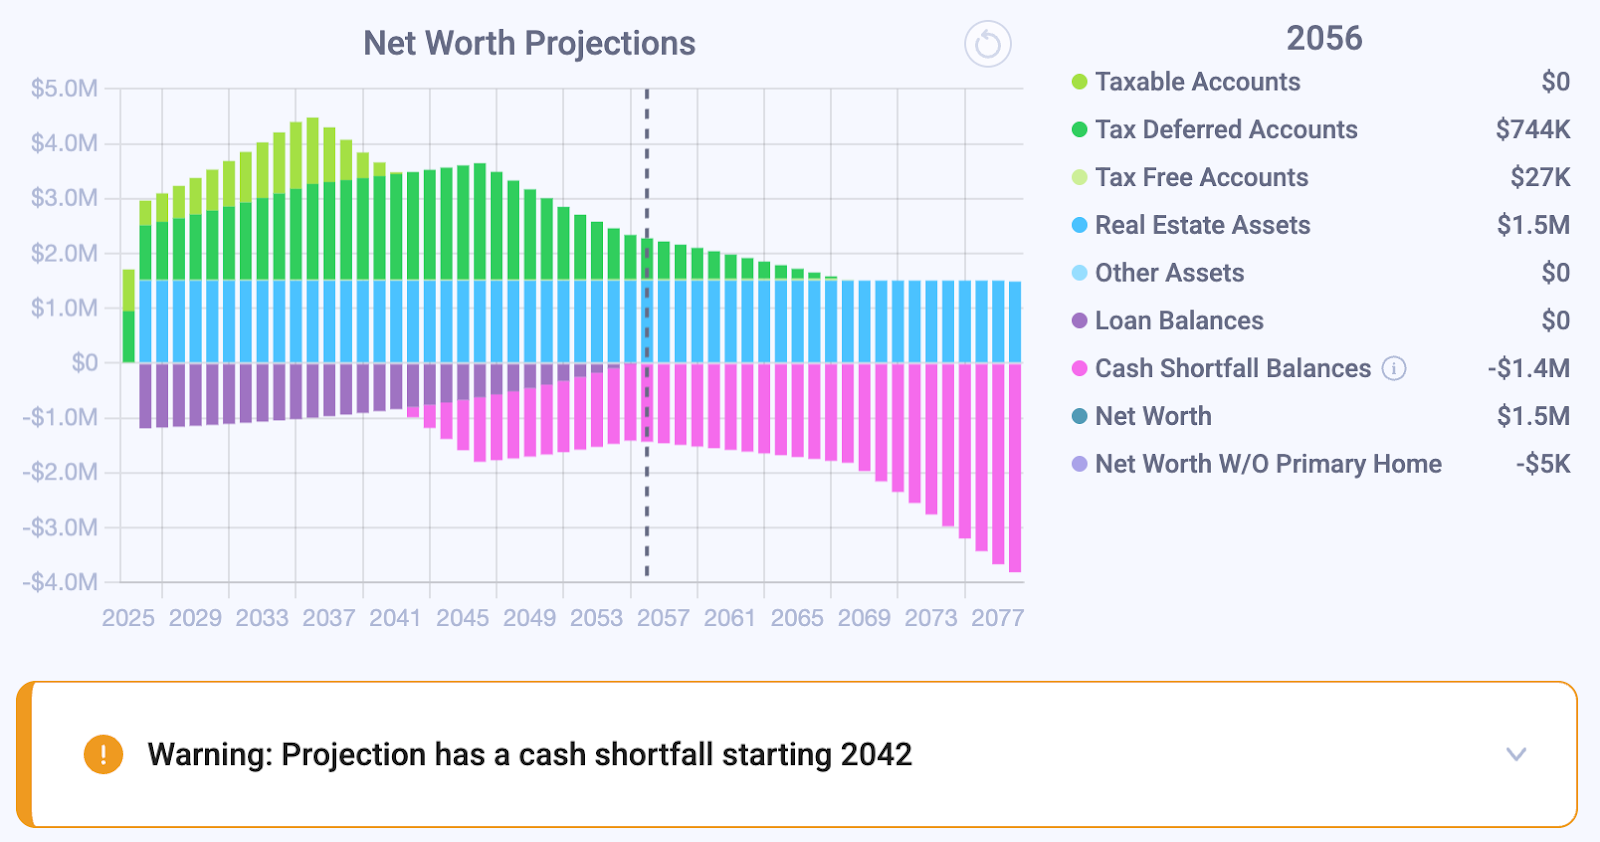
They have plenty of total wealth, but not enough spendable cash to cover expenses before they can withdraw from their retirement accounts without penalty.
If they had kept renting, their assets would have remained liquid and accessible — giving them much more flexibility in how and when to use their money.
Other Factors We Take Into Account
To make this comparison realistic, our model includes several key assumptions:
Account growth rate: 6%
If the couple doesn’t use their savings for a home down payment, the money stays invested and continues to grow at 6% per year.Inflation: 2%
All future values are adjusted for inflation so we can compare everything in today’s dollars.Location: California
The couple lives in California and pays state income tax in addition to federal taxes.Family: Two children, ages 5 and 7
They plan to fully fund college expenses of $50,000 per year per child (in today’s dollars) from ages 18–22 — which directly affects their cash flow.Living expenses: $84,000 per year (excluding rent or mortgage)
These expenses are assumed to grow with inflation over time.Retirement: Age 60
They retire at 60 and begin collecting Social Security benefits at age 65.
The Takeaway
There’s no one-size-fits-all answer.
Renting — offers more liquidity, flexibility, and less maintenance.
Buying — builds potential equity growth, but comes with higher upfront and ongoing costs.
The outcome depends on key factors like your mortgage rate, home appreciation rate, and how long you plan to stay.
The key isn’t guessing — it’s running the actual numbers.
Try It Yourself
At Nauma, we make this kind of scenario analysis simple. Check out this video on step by step guidance to do it yourself:
You can model your own financial plan — compare buying vs. renting, test different mortgage rates, or explore how early retirement might impact your liquidity and long-term net worth.
I assume you're building these calculators with API capability - they're very valuable and might offer interesting side monetization opportunities.
One thing that is a wildcard is the risk of property taxes, or insurance, increasing in real terms over time. Probably not a stretch in CA markets.
Good stuff - you're both on the right track here!